Eastman Exports
(A Division of Eastman Exports Global Clothing Pvt Ltd.,)5/591, Sri Lakshmi Nagar
Pitchampalayam, Pudur
Tirupur - 641 603,
Tamilnadu.
SBTi Progress Monitoring Report
SBTi Progress Monitoring Report
Eastman Exports Global Clothing Private Limited remains committed to reducing greenhouse gas (GHG) emissions and achieving science-based targets that align with the 1.5°C pathway. This report outlines our progress, strategies implemented, and commitments for the future.
GHG Inventory Data
Breakdown of Scope 3 Emissions
Major categories such as Purchased Goods and Services, Capital Goods, and Fuel & Energy-Related Activities saw significant reductions in emissions, reflecting Eastman's focus on sustainable procurement and operational efficiencies.
Strategies for Emission Reduction
Elimination of Coal Usage
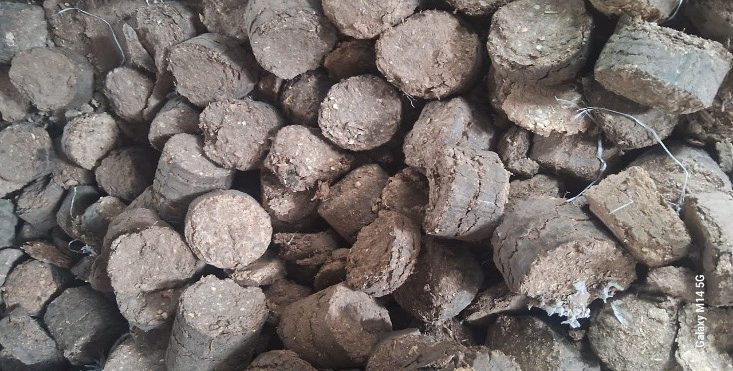
Eastman has successfully transitioned away from coal consumption by adopting bio briquettes, a renewable energy alternative derived from agricultural waste. This shift not only reduces GHG emissions but also aligns with our circular economy principles by utilizing local resources.

Energy Efficiency Improvements Through Energy Audits
Comprehensive energy audits have been conducted to identify inefficiencies and optimize energy use across our operations. As a result:
- We have implemented measures such as advanced insulation, energy-efficient machinery, and optimized production scheduling.
- These efforts have contributed to significant energy savings and reductions in Scope 1 and Scope 2 emissions.
Adoption of Renewable Energy
We have prioritized increasing renewable energy usage across our facilities:
- Tier 2 Facilities: Achieving 70% renewable energy adoption through strategic Power Purchase Agreements (PPAs) from 2024.
- Tier 3 Facilities: Securing 30% renewable energy through similar PPAs from 2024.
These measures have significantly decreased Scope 2 emissions and demonstrate our commitment to cleaner energy solutions.
Looking Ahead
Eastman Exports remains steadfast in its commitment to sustainability and will continue pursuing innovative strategies to further reduce emissions. We aim to achieve our science-based targets by fostering collaboration across the supply chain and investing in sustainable technologies.
GHG Inventory Data
| GHG Inventory Data | Base year data FY 2020 (April 2019 – March 2020) | FY 2024 (April 2023 – March 2024) | Brief description |
|---|---|---|---|
| Category name | Emissions (tCO2e) | Emissions (tCO2e) | |
| Scope 1 | 79,248.79 | 47,222.01 | Boiler (Steam generation), |
| Generator (Electricity generation in case of power cut), | |||
| Office Vehicle (for transportation) | |||
| Scope 2 location based | 60,343.46 | 27,733.99 | Manufacturing (where Purchased electricity is utilized) |
| Scope 3 Emissions | 216,333.88 | 130,104.83 | |
| 1. Purchased goods and services | 157,246.76 | 98,893.31 | Raw materials, Accessories, Maintenance, legal & accounting Services |
| 2. Capital goods | 3,872.73 | 1,401.98 | New machinery or other goods |
| 3. Fuel and energy related activities | 31,880.89 | 17,352.30 | Emissions from production of fuel & energy considered in scope 1 & Scope 2 |
| 4. Upstream transportation & distribution | 5,307.58 | 2329.693679 | Third party utilized for upstream transportation & distribution |
| 5. Waste generated in operations | 3,666.13 | 748.01 | Based on amount spent on waste management |
| 6. Business travel | 2402.094253 | 822.7002668 | Air travel, Hotel stays |
| 7. Employee commuting | 2,975 | 2,975 | Based on average number of employees |
| 8. Upstream leased assets | 0 | 0 | Scope 1 & 2 emissions of leased assets are considered directly in Scope 1 & 2 emissions |
| 9. Downstream transportation & distribution | 1572.662053 | 697.0210482 | Third party utilized for downstream transportation & distribution |
| 10. Processing of sold products | 0 | 0 | Sold product Processing Not applicable as we are selling only the finished goods i.e., Knitted garments like T-shirts, pants, etc., |
| 11. Use of sold products | 0 | 0 | Garment use stage washing - electricity consumption falls under optional source |
| 12. End-of-life treatment of sold products | 7410.0466 | 4884.808 | Garments disposed after usage |
| 13. Downstream leased assets | 0 | 0 | Not Applicable, we don’t have any downstream leased assets in the most recent year. |
| 14. Franchises | 0 | 0 | Not Applicable, We don’t have any franchise |
| 15. Investments | 0 | 0 | Not Applicable, Other Investments not done in the base year & most recent year. |

